Performance
The below documents REEM Performance. See the repository for the full source code and more information.
Data Transfer Rates
Both the database and pubsub paradigms use the same methods for data transfer. The below tests apply to both even though it was conducted in the database paradigm.
Number of Entries vs Latency
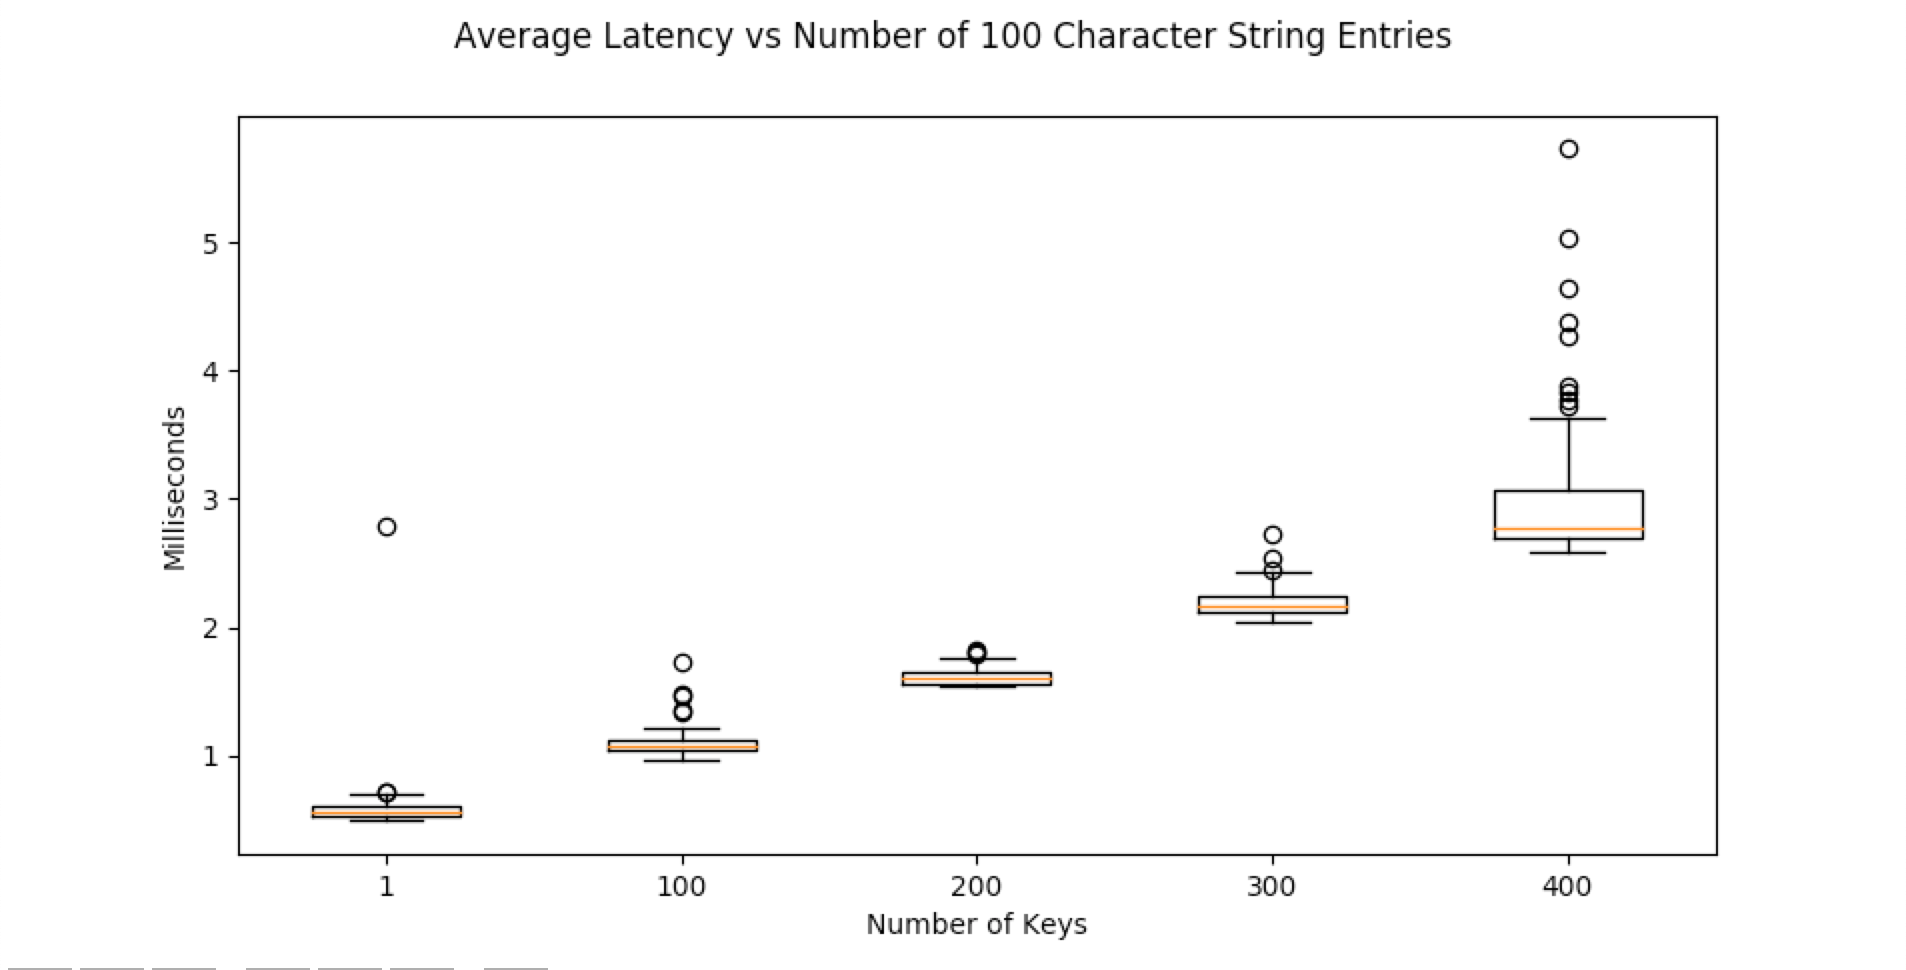
String Data
In the below test, a dictionary with X string entries was written to Redis. One hundred trials were conducted. The box-plots of their latency is below. Latency grows linearly with the amount of data sent. The source code to generate this plot is below.
    info = {"title": "Average Latency vs Number of 100 Character String Entries", "plots": [], "x_label": "Number of Keys"}
    for copies in [max(1, 100 * i) for i in range(5)]:
        data = single_level_dictionary(copies=copies, data={"single_key": "".join(["A" for i in range(10**2)])})
        p = {
            "ticker_label": copies,
            "times": multitrial_time_test(set, {"keys": ["key_growth"], "value": data}, iterations=100)
        }
        info["plots"].append(p)
        print("Completed: {}".format(copies))
    plot_performance(info)
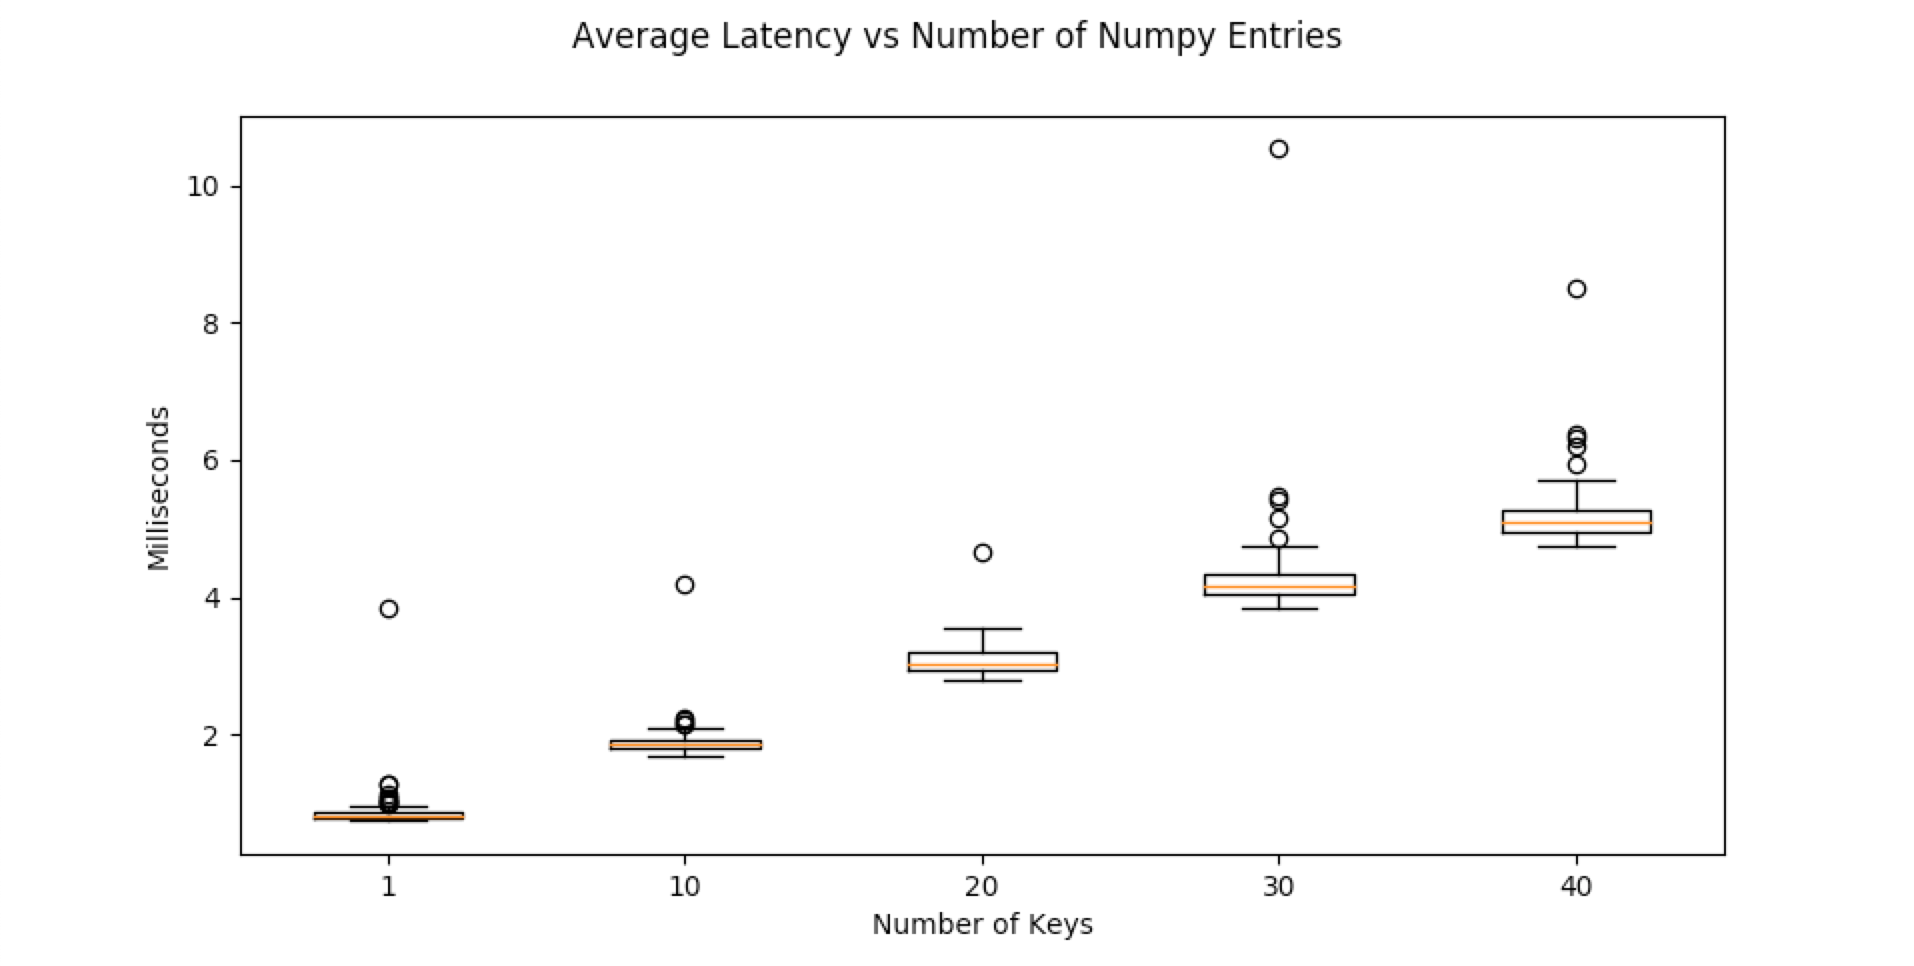
Numpy Data
In the below test, a dictionary with X numpy array entries was written to Redis. One hundred trials were conducted. The box-plots of their latency is below. Latency grows linearly with the amount of data sent. The source code to generate this plot is below.
    info = {"title": "Average Latency vs Number of Numpy Entries", "plots": [], "x_label": "Number of Keys"}
    for copies in [max(1, 10 * i) for i in range(5)]:
        data = single_level_dictionary(copies=copies, data={"single_key": np.random.rand(3, 4)})
        p = {
            "ticker_label": copies,
            "times": multitrial_time_test(set, {"keys": ["key_growth_numpy"], "value": data}, iterations=100)
        }
        info["plots"].append(p)
        print("Completed: {}".format(copies))
    plot_performance(info)
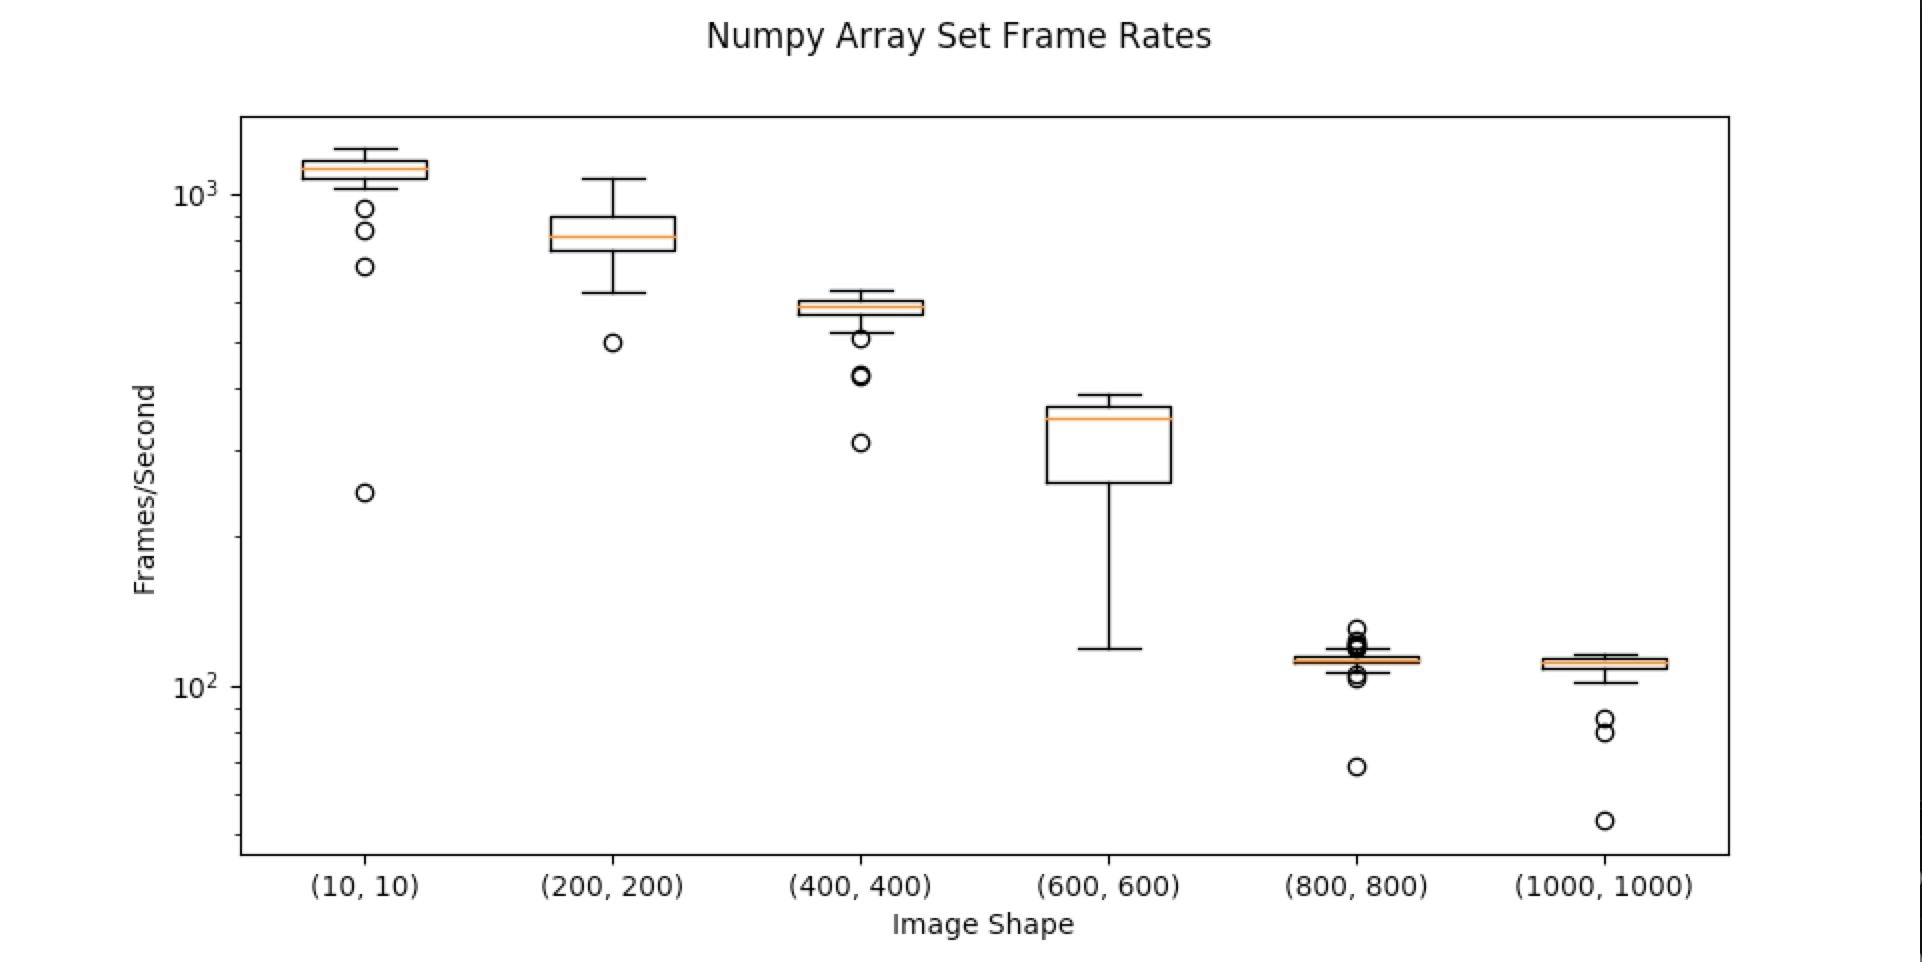
Numpy Array Size Throughput
Set
A numpy array of size (N x N) was uploaded to the server as fast as possible. Frame rates are shown below
    info = {"title": "Numpy Array Set Frame Rates", "plots": [], "x_label": "Image Shape", "y_label": "Frames/Second", "y_scale":'log'}
    # sets = [np.random.rand(640, 480, 3), np.random.rand(720, 480, 3), np.random.rand(1080, 720, 3)]
    sets = [np.random.rand(max(10, 200 * i), max(10, 200 * i)) for i in range(6)]
    for arr in sets:
        trials = multitrial_time_test(set, {"keys": ["np_frame_rate_test", "key"], "value": arr}, iterations=50)
        trials = [1000.0/t for t in trials]
        p = {
            "ticker_label": arr.shape,
            "times": trials
        }
        info["plots"].append(p)
    plot_performance(info)
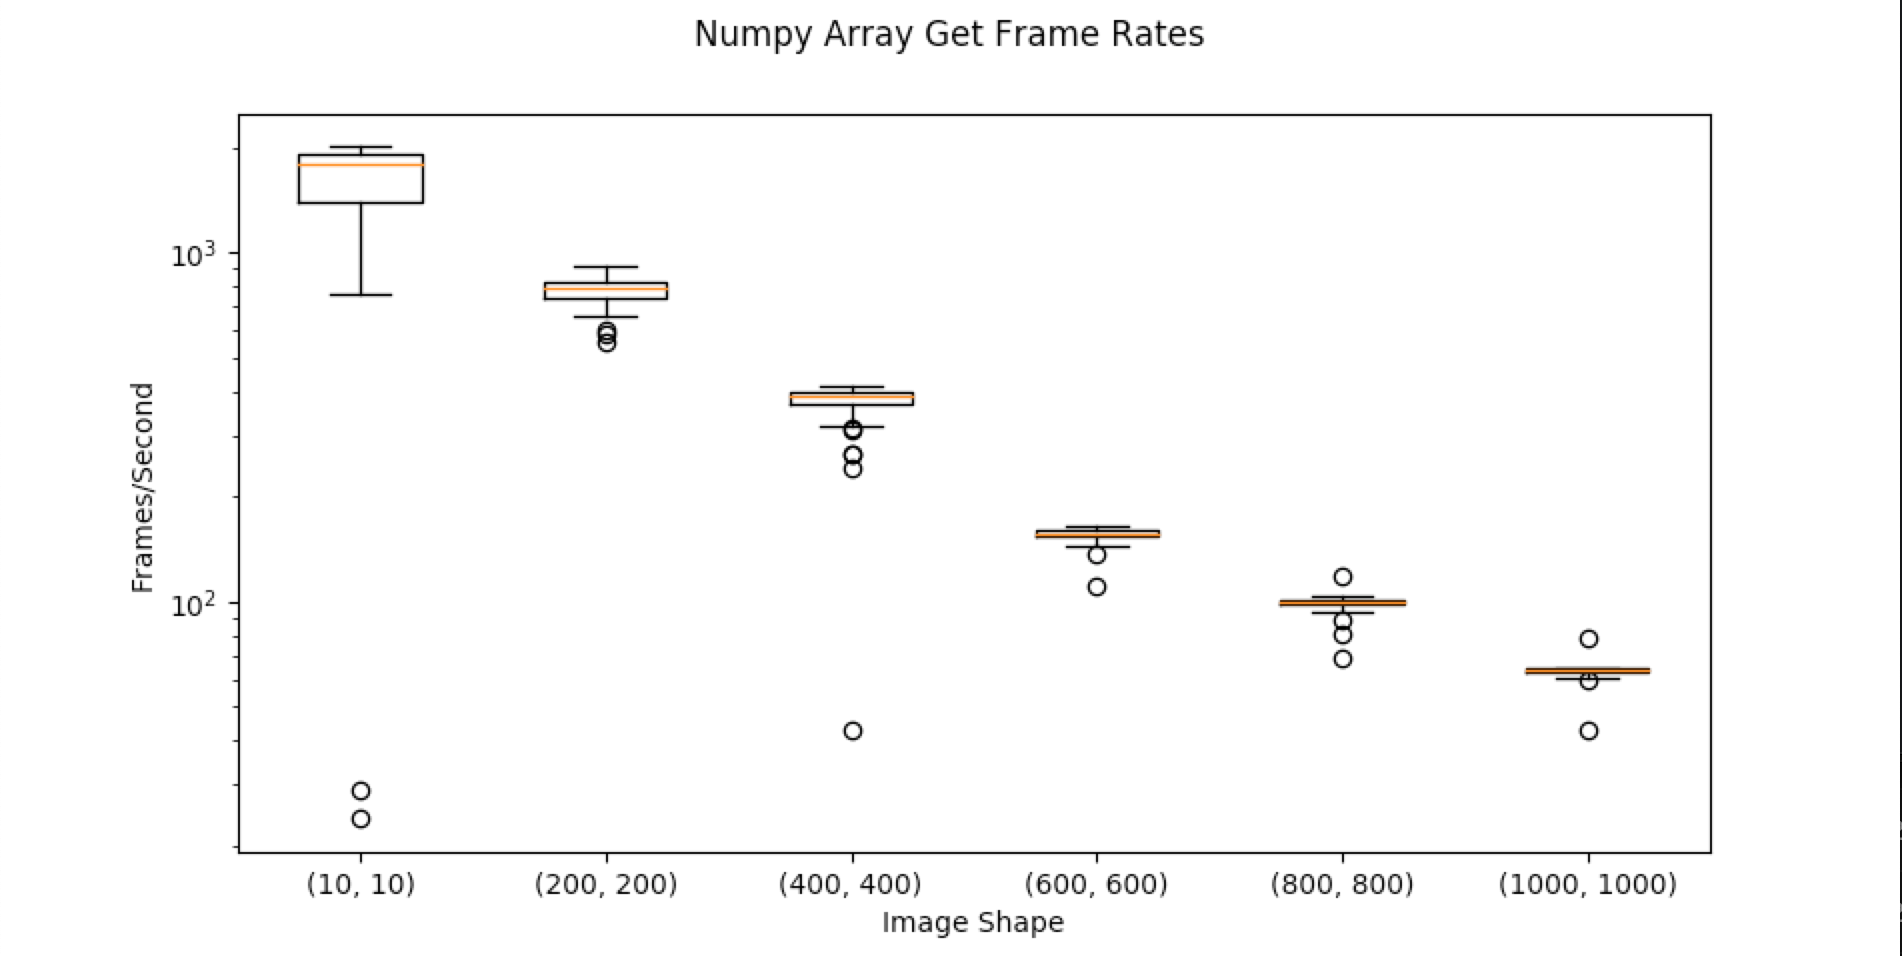
Get
A numpy array of size (N x N) was downloaded from the server as fast as possible. Frame rates are shown below
def numpy_get_frame_rates():
    info = {"title": "Numpy Array Get Frame Rates", "plots": [], "x_label": "Image Shape", "y_label": "Frames/Second", "y_scale":'log'}
    # sets = [np.random.rand(640, 480, 3), np.random.rand(720, 480, 3), np.random.rand(1080, 720, 3)]
    sets = [np.random.rand(max(10, 200 * i), max(10, 200 * i)) for i in range(6)]
    for arr in sets:
        kvs["read_frame_rate_test"]["subkey"] = arr
        trials = multitrial_time_test(get, {"keys": ["read_frame_rate_test", "subkey"]}, iterations=50)
        trials = [1000.0 / t for t in trials]
        p = {
            "ticker_label": arr.shape,
            "times": trials
        }
        info["plots"].append(p)
Subscriber Overhead
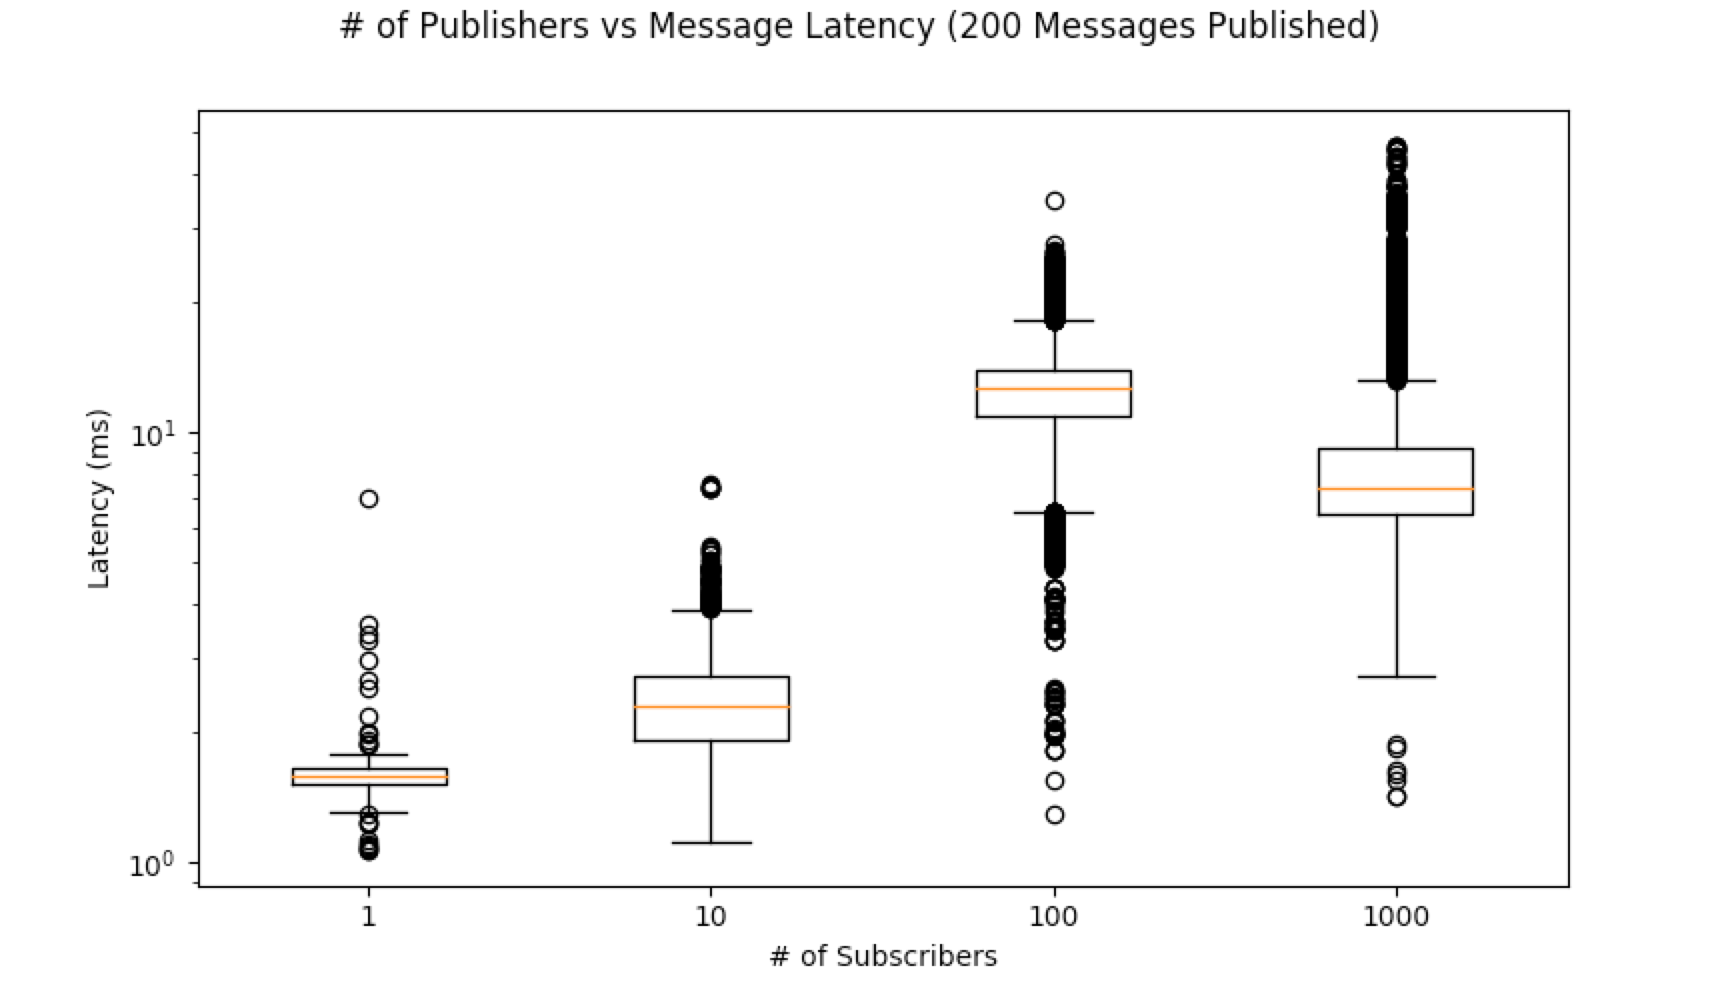
The below code tested what the overhead was with having multiple subscribers to a given channel. The publisher and each subscriber was run in it’s own process on the same machine. A publisher uploaded a timestamp and subscribers calculated the difference between the timestamp and the time they read the image.
PULSE_GAP = 0.02
TRIALS = 200


def append_time_to_list(data, updated_path, times):
    times.append(time.time() - data["timestamp"])


def overhead_testing_subscriber(test_name, timeout=10):
    times = []
    interface = RedisInterface()
    subscriber = CallbackSubscriber("overhead_test", interface, append_time_to_list, {"times": times})
    subscriber.listen()
    time.sleep(timeout)
    base = os.path.dirname(os.path.abspath(__file__))
    save_dir = os.path.join(base, "logs", "overhead_test", test_name)
    save_path = os.path.join(save_dir, "subscriber_{}.txt".format(os.getpid()))
    if not os.path.exists(save_dir):
        os.makedirs(save_dir)
    with open(save_path, "w") as f:
        for t in times:
            f.write("{}\n".format(t))


def overhead_testing_publisher():
    interface = RedisInterface()
    publisher = PublishSpace(interface)
    for i in range(TRIALS):
        publisher["overhead_test"] = {"timestamp": time.time()}
        time.sleep(PULSE_GAP)


def generate_subscriber_overhead_data(num_subscriber_list):
    base = os.path.join(os.path.dirname(os.path.abspath(__file__)), "logs", "overhead_test")
    shutil.rmtree(base)
    for num_subscribers in num_subscriber_list:
        processes = [(overhead_testing_publisher, (), {})]
        test_name = "subs={}".format(num_subscribers)
        save_dir = os.path.join(base, test_name)
        if not os.path.exists(save_dir):
            os.makedirs(save_dir)

        for i in range(num_subscribers):
            processes.append((overhead_testing_subscriber, (test_name, PULSE_GAP * TRIALS), {}))

        run_as_processes(processes)
        print("Completed test with {} subscribers".format(num_subscribers))


def plot_overhead_data():
    time_data = {}
    base = os.path.dirname(os.path.abspath(__file__))
    save_dir = os.path.join(base, "logs", "overhead_test")
    for dirpath, dirs, files in os.walk(save_dir):
        if "subs" not in dirpath:
            continue
        num_subscribers = int(dirpath.split("subs=")[1])
        time_data[num_subscribers] = []
        for fpath in files:
            with open(os.path.join(dirpath, fpath), 'r') as file:
                for line in file:
                    time_data[num_subscribers].append(float(line) * 1000)   # Seconds to milliseconds conversion
    plot_info = {
        "title": "# of Publishers vs Message Latency ({} Messages Published)".format(TRIALS),
        "x_label": "# of Subscribers",
        "y_label": "Latency (ms)",
        "y_scale": "log",
        "plots": []
    }
    for key, value in sorted(time_data.items(), key=lambda kv: kv[0]):
        plot_info["plots"].append({"ticker_label": key, "times": value})
    plot_performance(plot_info)


def overhead_tests_main():
    generate_subscriber_overhead_data([1, 10, 100, 1000])
    plot_overhead_data()
Comparison
There exist other packages that provide similar but not identical functionality to REEM.
Potteryx
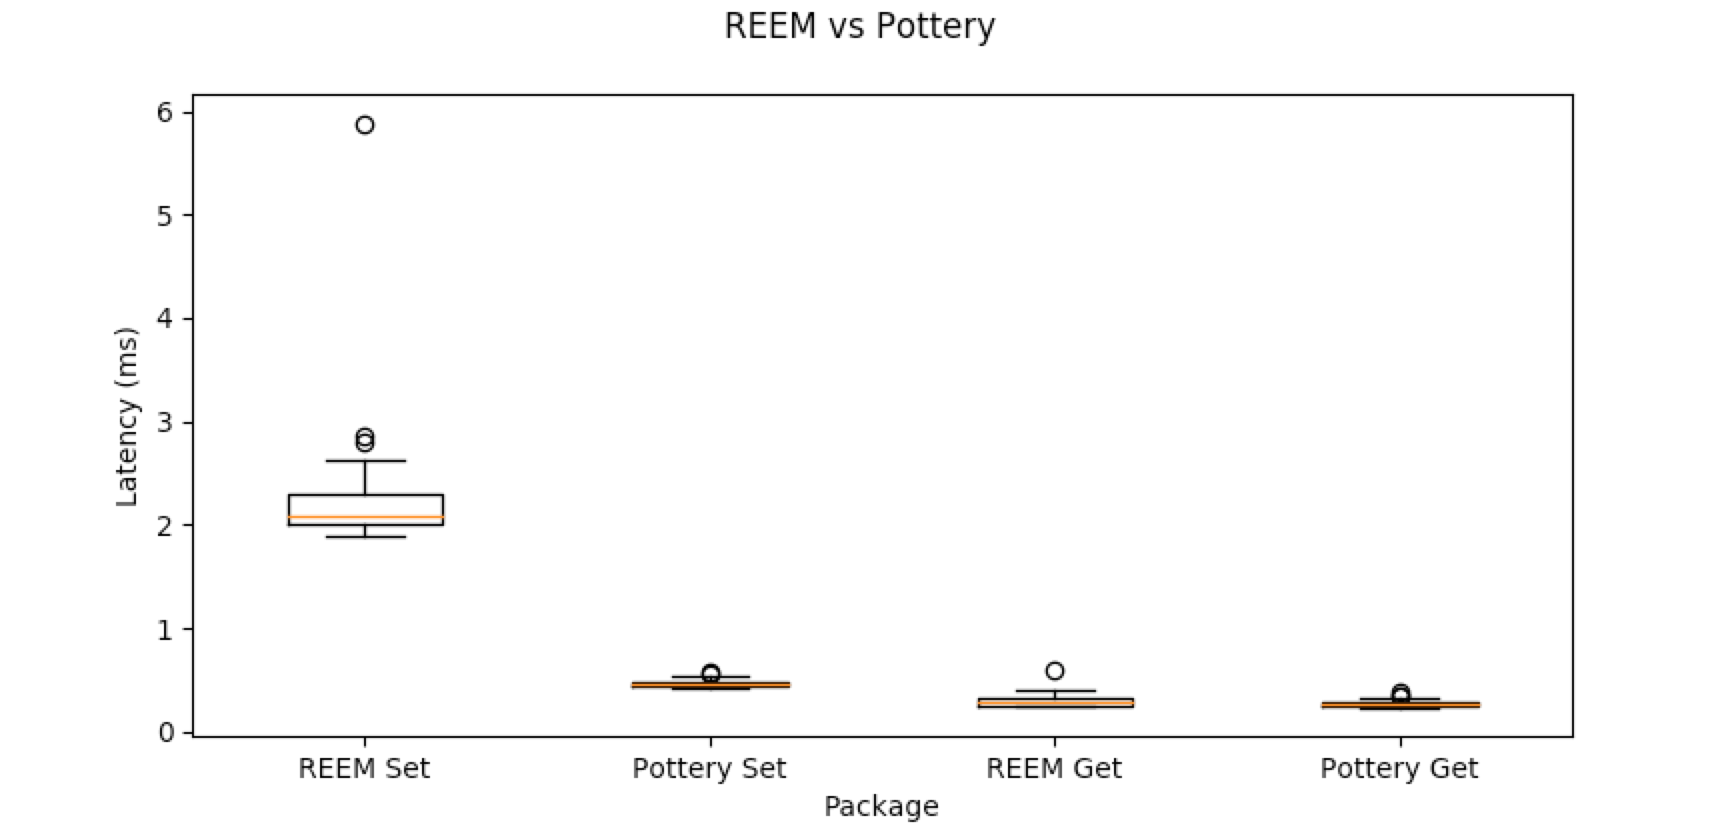
The package potteryx offers pythonic ways of using Redis data types. It’s implementation for setting JSON-compatible data is faster than REEM but gets are comparable.
The comparison was generated with the following code:
def set_pottery(redis_dict, value):
    redis_dict["data"] = value


def get_pottery(redis_dict, keys):
    ret = redis_dict
    for k in keys:
        ret = ret[k]
    return ret


def compare_to_potteryx():
    client = Redis.from_url('redis://localhost:6379/')
    pottery_dict = RedisDict(redis=client, key='pottery')

    info = {"title": "REEM vs Pottery", "plots": [],
            "x_label": "Package",
            "y_label": "Latency (ms)"}

    data = nested_level_dictionary(
        levels=5,
        data=single_level_dictionary(
            copies=100,
            data={
                "single_key": "".join(["A" for i in range(10 ** 2)]),
                "nested_data": {
                    "subkey": "".join(["A" for i in range(10 ** 2)])
                }
            }
        )
    )
    # REEM Set
    p = {
        "ticker_label": "REEM Set",
        "times": multitrial_time_test(set, {"keys": ["pottery_comparison"], "value": data}, iterations=100)
    }
    info["plots"].append(p)

    # Pottery Set
    p = {
        "ticker_label": "Pottery Set",
        "times": multitrial_time_test(set_pottery, {"redis_dict": pottery_dict, "value": data}, iterations=100)
    }
    info["plots"].append(p)

    reem_read_path = path_to_key_sequence(".pottery_comparison.sub_0.sub_1.sub_2.sub_3.sub_4.copy_0_single_key")
    pottery_read_path = path_to_key_sequence(".data.sub_0.sub_1.sub_2.sub_3.sub_4.copy_0_single_key")
    # REEM Get
    p = {
        "ticker_label": "REEM Get",
        "times": multitrial_time_test(get, {"keys": reem_read_path}, iterations=100)
    }
    info["plots"].append(p)

    # Pottery Get
    p = {
        "ticker_label": "Pottery Get",
        "times": multitrial_time_test(get_pottery, {"redis_dict": pottery_dict, "keys": pottery_read_path}, iterations=100)
    }
    info["plots"].append(p)

    plot_performance(info)
Pottery does not use ReJSON. To store nested data, potteryx serializes data deeper than one level inside a
Python dictionary to JSON. The JSON is then stored as a subkey of Redis Hash.
Pottery will require some extra work to get non-serializable data like numpy arrays to work with it.